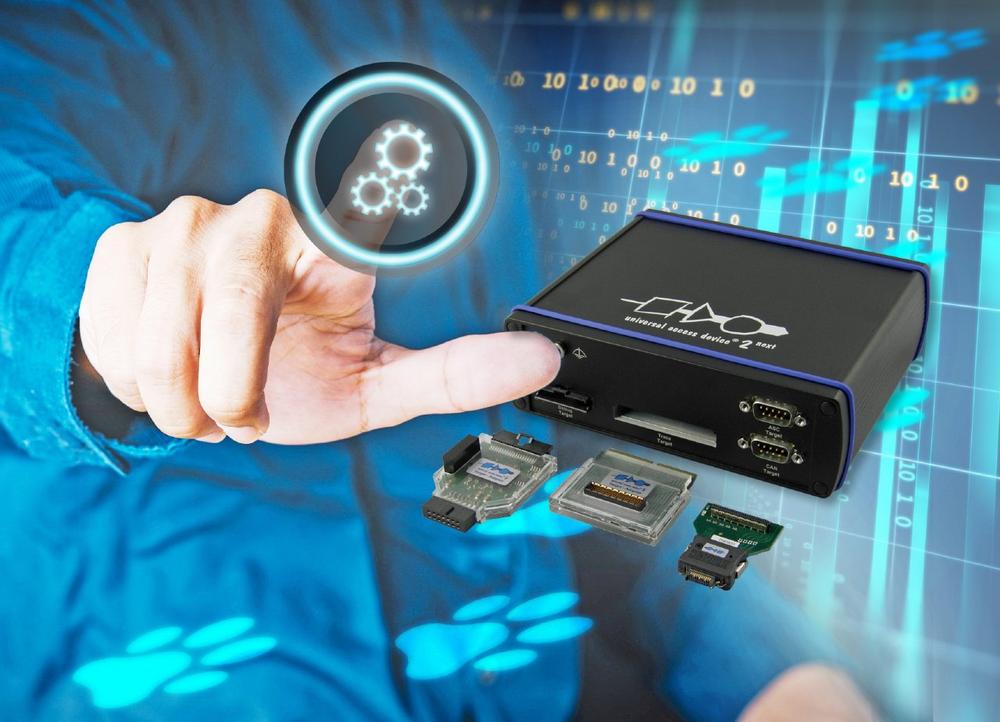
Nowadays, tracing is an essential debug method for investigating errors, timing problems or identifying bottlenecks in embedded applications, especially when the runtime behavior of the application under investigation must not be influenced during debugging. However, for efficient use of trace, the trace system of the microcontroller used must first be configured accordingly. This is usually not a trivial matter. The whole process can be very time-consuming and often requires in-depth knowledge of the SoC’s trace system.
The UDE SimplyTrace functions make this process easier by taking trace functions from typical use cases and attaching them to the various debugger views in a context-sensitive manner. For example, trace recording can be configured directly from the source code window for the use cases "trace from source code line" or "trace to source code line". This is as easy as setting a breakpoint. In addition, the trace configuration created with the UDE SimplyTrace functions can also be subsequently customized and extended using the regular UDE configuration tools.
The implementation of the feature is based on an increasing abstraction across different layers. The bottom layer contains the functions of the on-chip trace components, while the top layer reflects the software developer’s use cases. This approach makes it easy to extend the system with respect to new trace architectures as well as further use cases.
The first UDE SimplyTrace implementation initially provides the most commonly used program trace functions as well as basic data trace use cases, such as the observation of data accesses to variables. Further use cases, such as data trace of register accesses or simplified task trace for real-time operating systems, are under development.
Experienced developers who are already familiar with the trace features of their microcontrollers can use the trace configurations created with UDE SimplyTrace as templates and edit them using the regular configuration tools in UDE, such as the Universal Emulation Configurator (UEC). This allows the user to customize or extend the trace task in case the specific requirements go beyond the typical use cases.
The new approach for the easy use of trace works in principle completely independent of the used microcontroller. Since the user does not have to deal with the special adaptations of the UDE SimplyTrace functions to the respective trace system, the training effort is extremely low, but the learning curve is steep. As a result, UDE SimplyTrace can greatly simplify and accelerate the software testing, run-time analysis, and system optimization phases.
With UDE 2023, the UDE SimplyTrace functions are now available for the Infineon AURIX family, for Arm Cortex MCUs with the corresponding CoreSight debug and trace system, and for devices based on PowerArchitecture with NEXUS Class 3 trace support.
PLS Programmierbare Logik & Systeme GmbH, based in Lauta (Germany), is the manufacturer of the debugger, test and trace framework Universal Debug Engine® (UDE®). Thanks to its innovative tools for embedded software development, PLS has developed into one of the technology leaders in this field since its foundation in 1990. The UDE combines powerful capabilities for debugging, testing and system-level analysis with efficiency and ease of use. The UAD2pro, UAD2next and UAD3+ access devices of the Universal Access Device (UAD) family complete the comprehensive debug functions of UDE and enable fast, robust and flexible communication with the target system.
For further information about our company, products and services, please visit our website at www.pls-mc.com.
PLS Programmierbare Logik & Systeme GmbH
Straße der Freundschaft 92
02991 Lauta
Telefon: +49 (35722) 384-0
Telefax: +49 (35722) 384-69
http://www.pls-mc.com
Technologiepark
Telefon: +49 (35722) 384-0
Fax: +49 (35722) 384-69
E-Mail: jens.braunes@pls-mc.com
3W Media & Marketing Consulting
Telefon: +49 (8761) 759203
Fax: +49 (8761) 759201
E-Mail: werner.wiesmeier@online.de
![]()
